Recurrence quantification analysis of EEG data in order to detect drowsiness
In this project, we used the theory of nonlinear dynamic systems to assess the brain dynamic alternation during the alert and drowsy states. To this end, we extracted the nonlinear Features of EEG signals of human subjects using Recurrence quantification analysis (RQA) features.
Recurrence quantification analysis
RQA is developed to investigate the behavior of dynamical systems by quantifying the number of recurrences in their phase space trajectories[1]. In this approach, at first, the phase space of a system is reconstructed from the observation data and mapped into a matrix called a recurrence plot. Then, the duration and the number of recurrences are calculated to estimate the level of predictability of the given dynamic system.
In this project, we used RQA to estimate the recurrence rate in EEG data. We hypothesized that by considering the brain as a dynamical system, its behavior becomes less deterministic during alert state and the phase space reconstructed from the EEG data is more chaotic. In contrast, during the drowsy state, the brain regions become more synchronized and the reconstructed phase space reflects higher periodicity, showing a hither distribution of diagonal lines in recurrence plots.
Nonliear analysis of EEG data
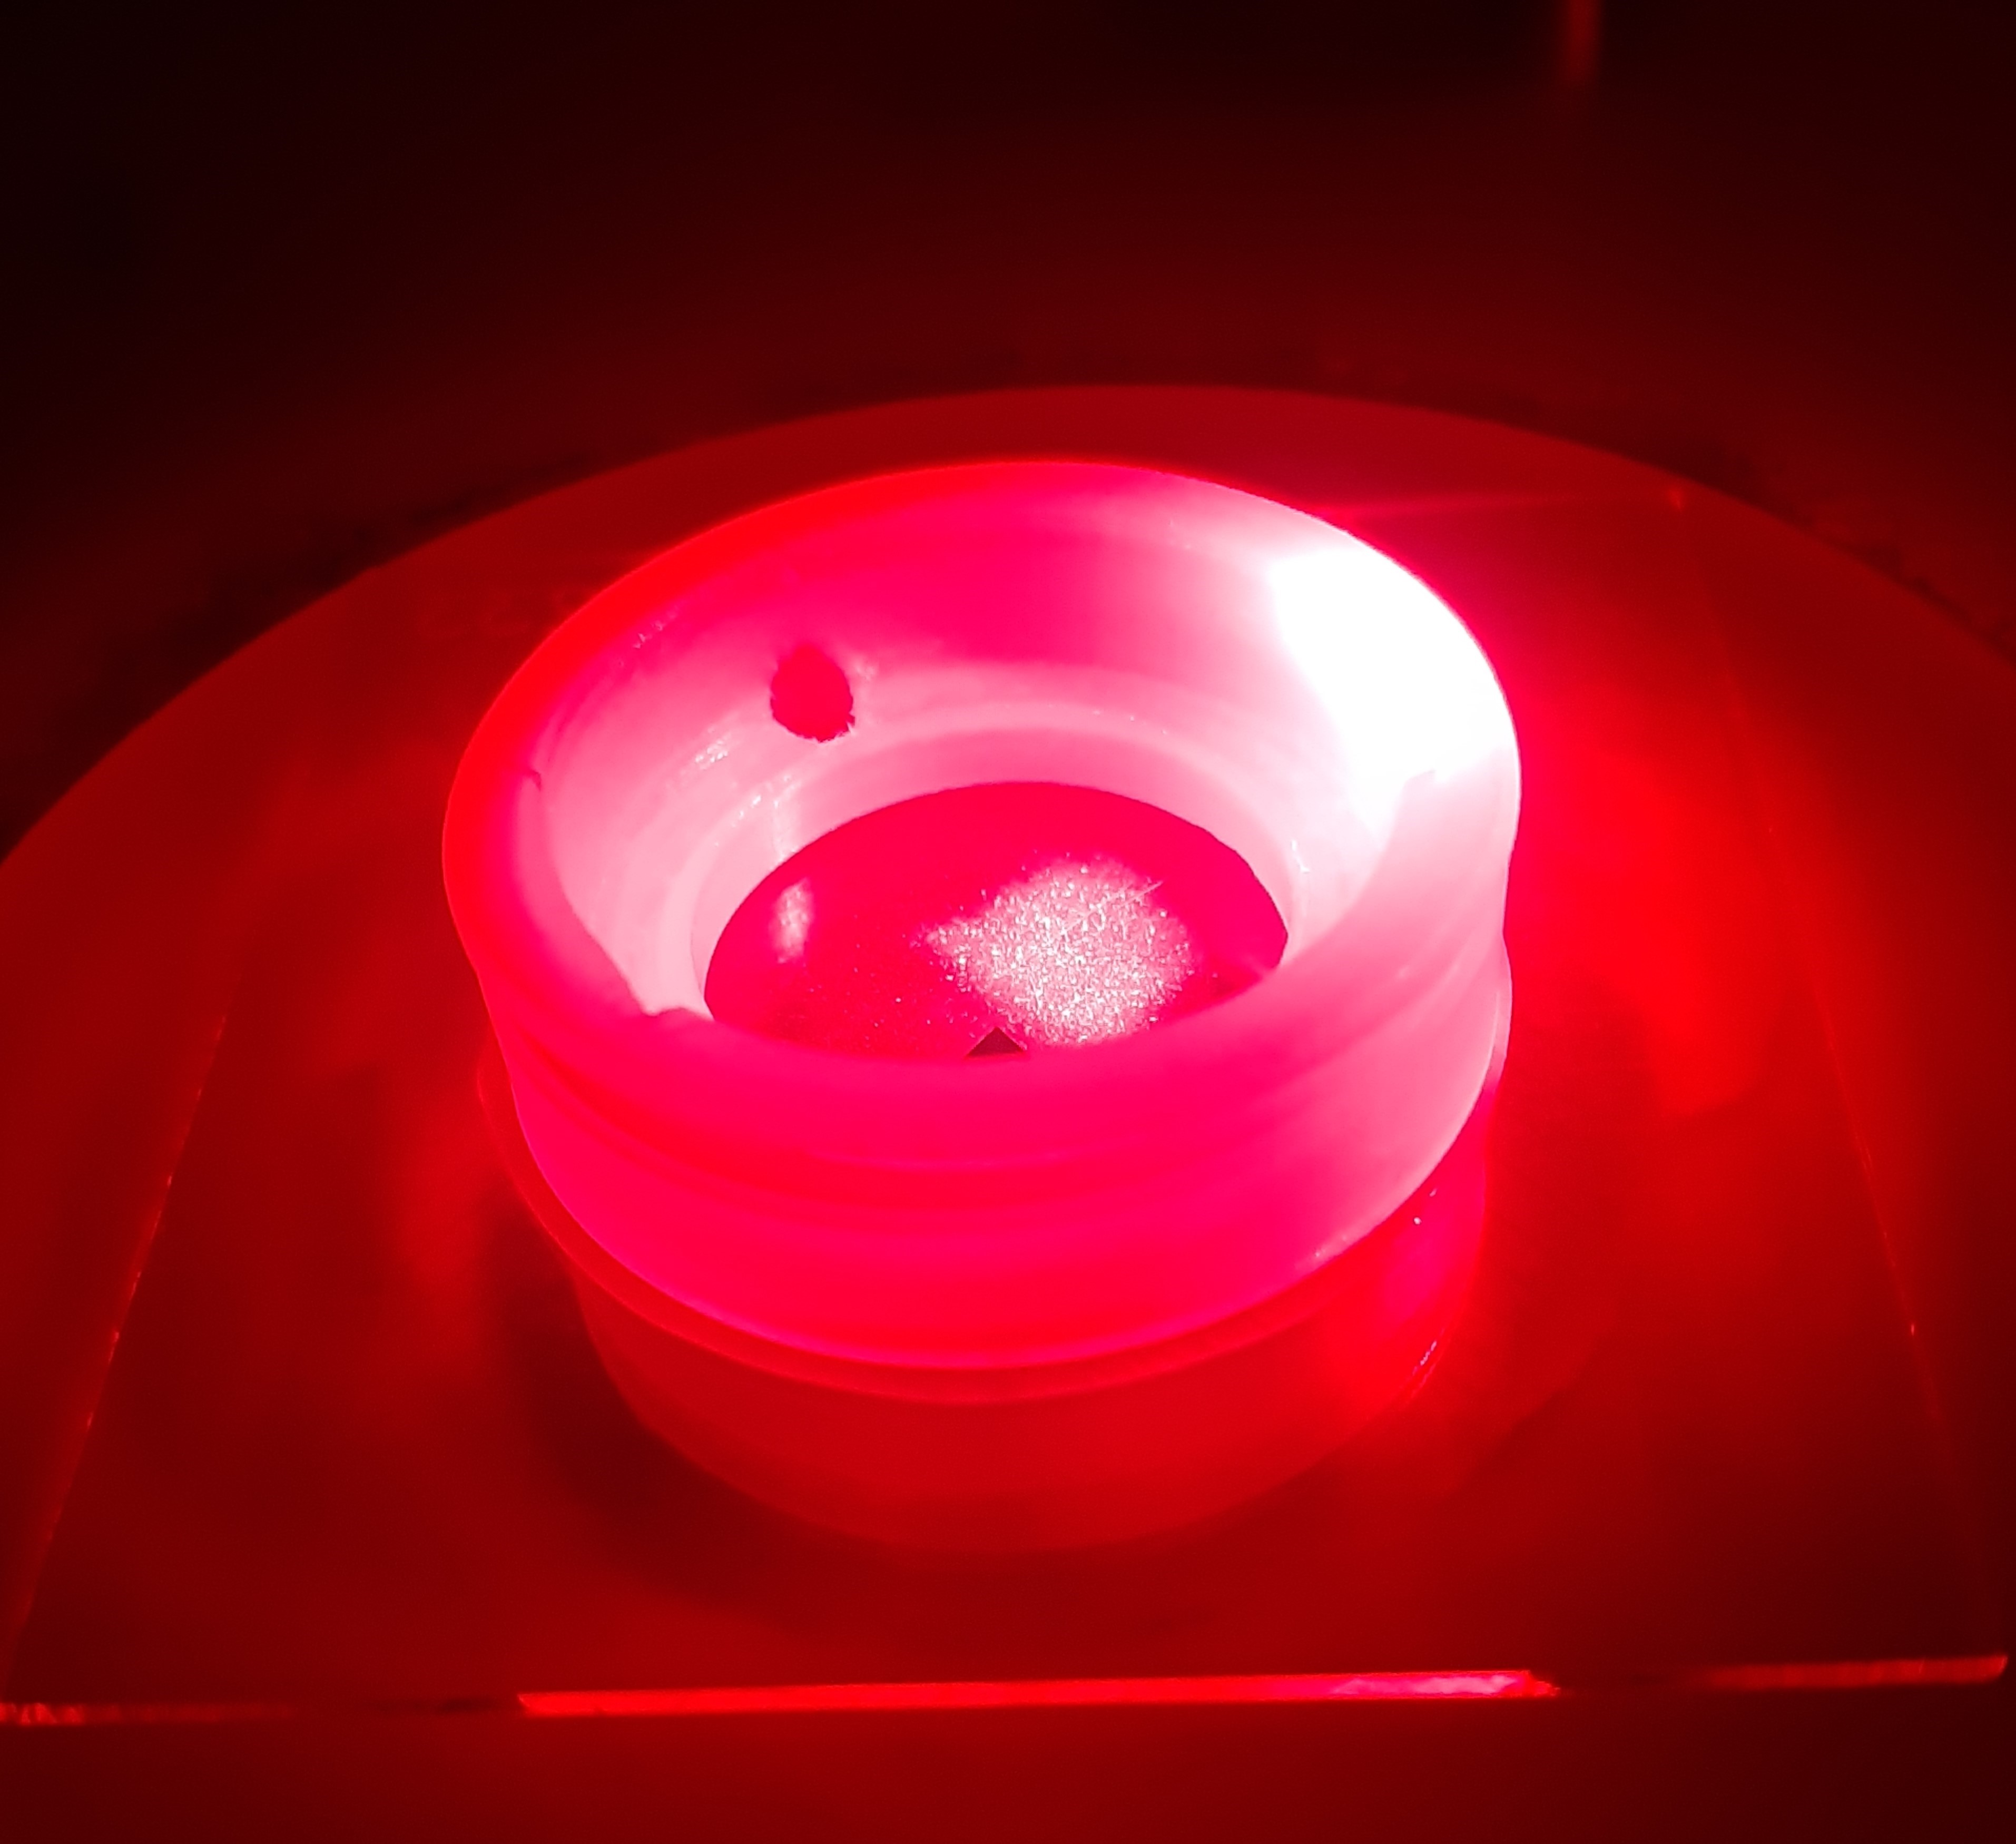
For this study, I recorded EEG data of 9 sleep-deprived human subjects while performing a driving task in a virtual driving environment (figure 1). Each experiment took about one hour and subjects were asked to report the level of drowsiness during the task. Additionally, subjects were scored by assessing their driving performance and their behavior by an observer. We used these criteria to label the EEG signals as alert and drowsy.
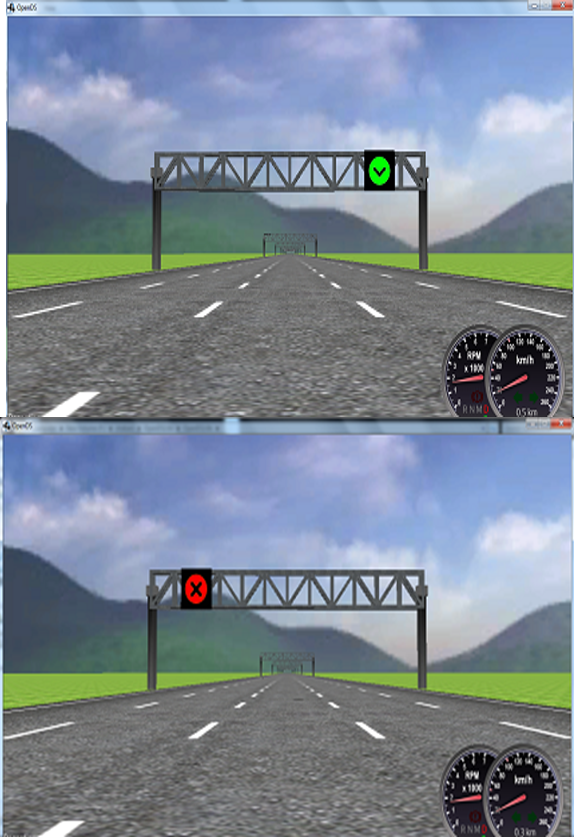
Figure 1: The virtual environment used for performing the driving tasks. EEG of subjects was collected during the task.
In the next step, we extracted the recurrence plots of the labeled EEG segments for different regions of the brain (figure 2). The figure below illustrates recurrence plots of sample alert and drowsy segments. Then we used RQA to quantify the predictability of EEG signals using the Determinism (DET) metric. This measure computes the histogram of the lengths of the diagonal lines in recurrence plots. When a dynamic system enters the chaotic regime duration of its recurrence plots’ diagonal lines will decrease and the DET measure will be smaller consequently. Therefore, the lower DET values may represent a higher level of alertness and vice versa.
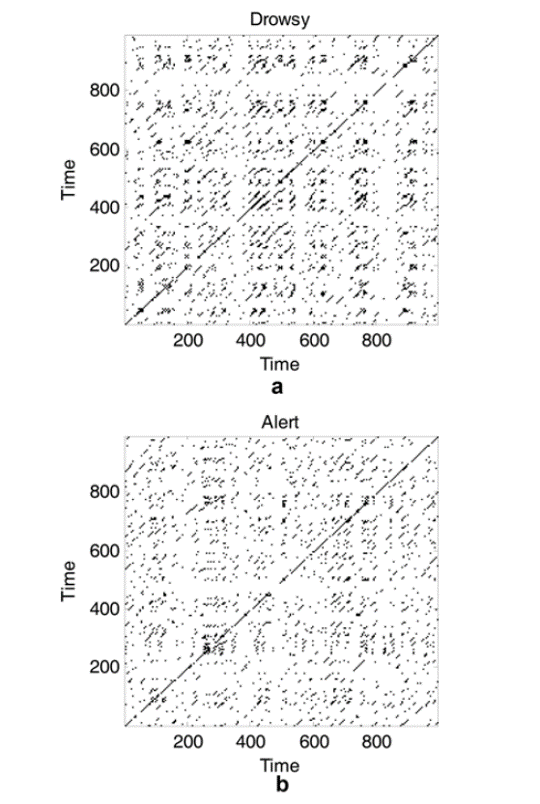
Figure 2: Recurrence plots of two sample segments of EEG during Alert and drowsy states. The number of diagonal lines is increased in the drowsy state.
DET was computed and averaged for three-second EEG segments. Notably, We observed meaningful differences in DET across several regions of the brain in alert and drowsy states. These results show that RQA can be used as an accurate tool to measure drowsiness (figure 3). In particular, since the method can be applied on short EEG segments it can be implemented for real-time detection of drowsiness.
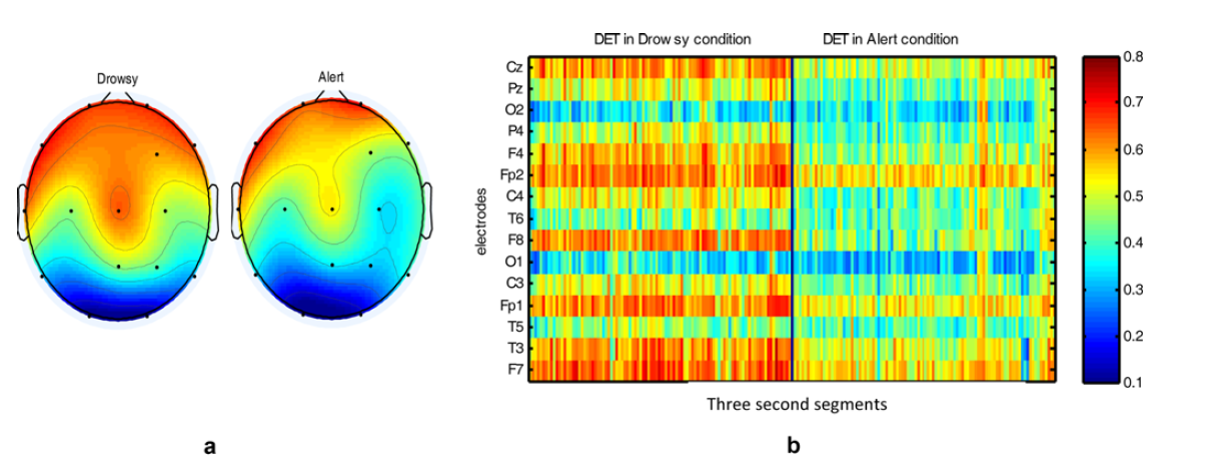
Figure 3.
(a) Topographic map of drowsy and alert states for DET index. (b) The difference in the DET index at different channels for drowsy and alert states.
Click here to see the high quality image
Supervisor: Dr. Mohammad Mikaili.
