Effect of stimulus onset on response variability
Although the source of response variability is not clearly understood, a common idea is that neural response variability originates from the internal activity of neural circuits and declines after stimulus onset [1-3]. By, assessing firing rate (FR) and between trial variability during Churchland et al. [2] showed that regardless of brain state during the task, stimulus onset leads to a significant decline in response variability in different areas of cortex such as V1, V4, MT, the lateral intra-parietal area (LIP), the parietal reach region (PRR), dorsal premotor cortex (PMd), and the orbitofrontal cortex (OFC). This decline can be observed even for non-responsive conditions. This phenomenon represents a general property of the cortex in which the state of the cortex stabilizes with input [2].
By evaluating the activity of the same data we observed that in some cases not only the response variability is not reduced after stimulus onset but it may stay constant or even increase during the evoked period. These results were in agreement with the Larry Abbot’s theoretical work that shows under specific conditions response variability could be unchanged after stimulus onset1. We studied the same datasets and noticed there is a minority of the population that show opposite behavior and be ignored during the averaging process. Here we want to assess the role of this population of neurons and to better understand their role in the neural circuits.
Fano Factor
The Fano factor (FF) is the ratio of the variance of mean firing rate (FR) across different trials to the mean, which is used to measure the across trial variability. We used this metric to quantify the alternations of variability over the course of time. To make the metric Independent from firing rate, we implemented the mean matching method introduced by Churchland et al. In this method, the FF is calculated only for the responses whose mean firing rate stays unchanged before and after stimulus onset.
In order to calculate FF and FR, we used the toolbox provided by Churchland [2]. The figure below illustrates the mean of FF and FR for MT and PMd datasets. In both data sets stimulus, onset appears 400 ms after baseline activity. Normal FF is shown in gray, and black curves show the mean-matched FF. The normal and the mean-matched FF are very similar in all plots, which means the increase in FR at stimulus onset does not affect the reliability of FF.
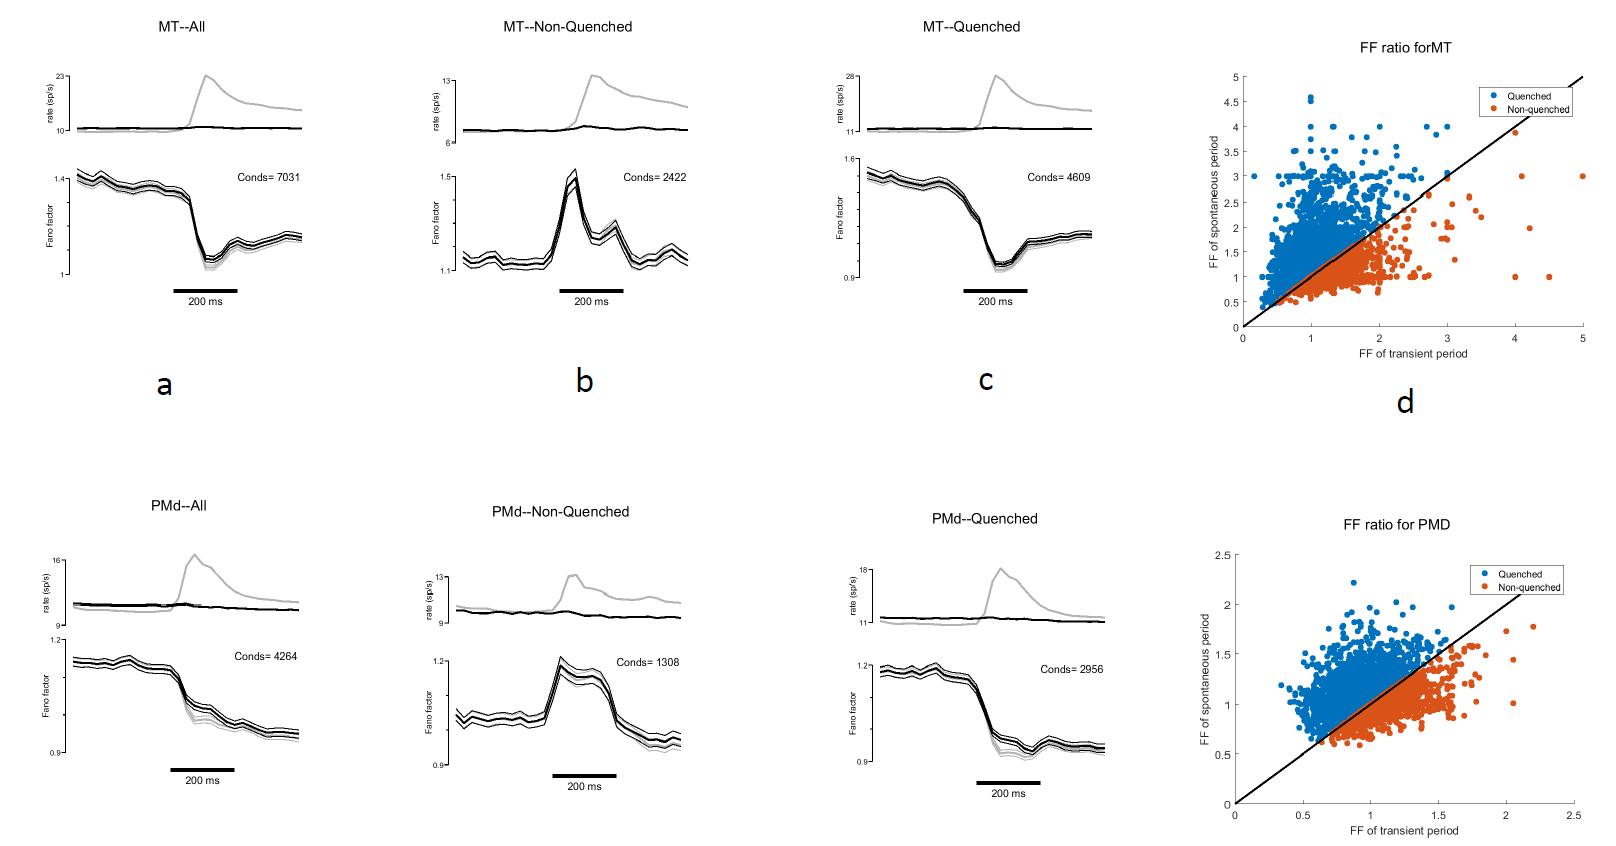
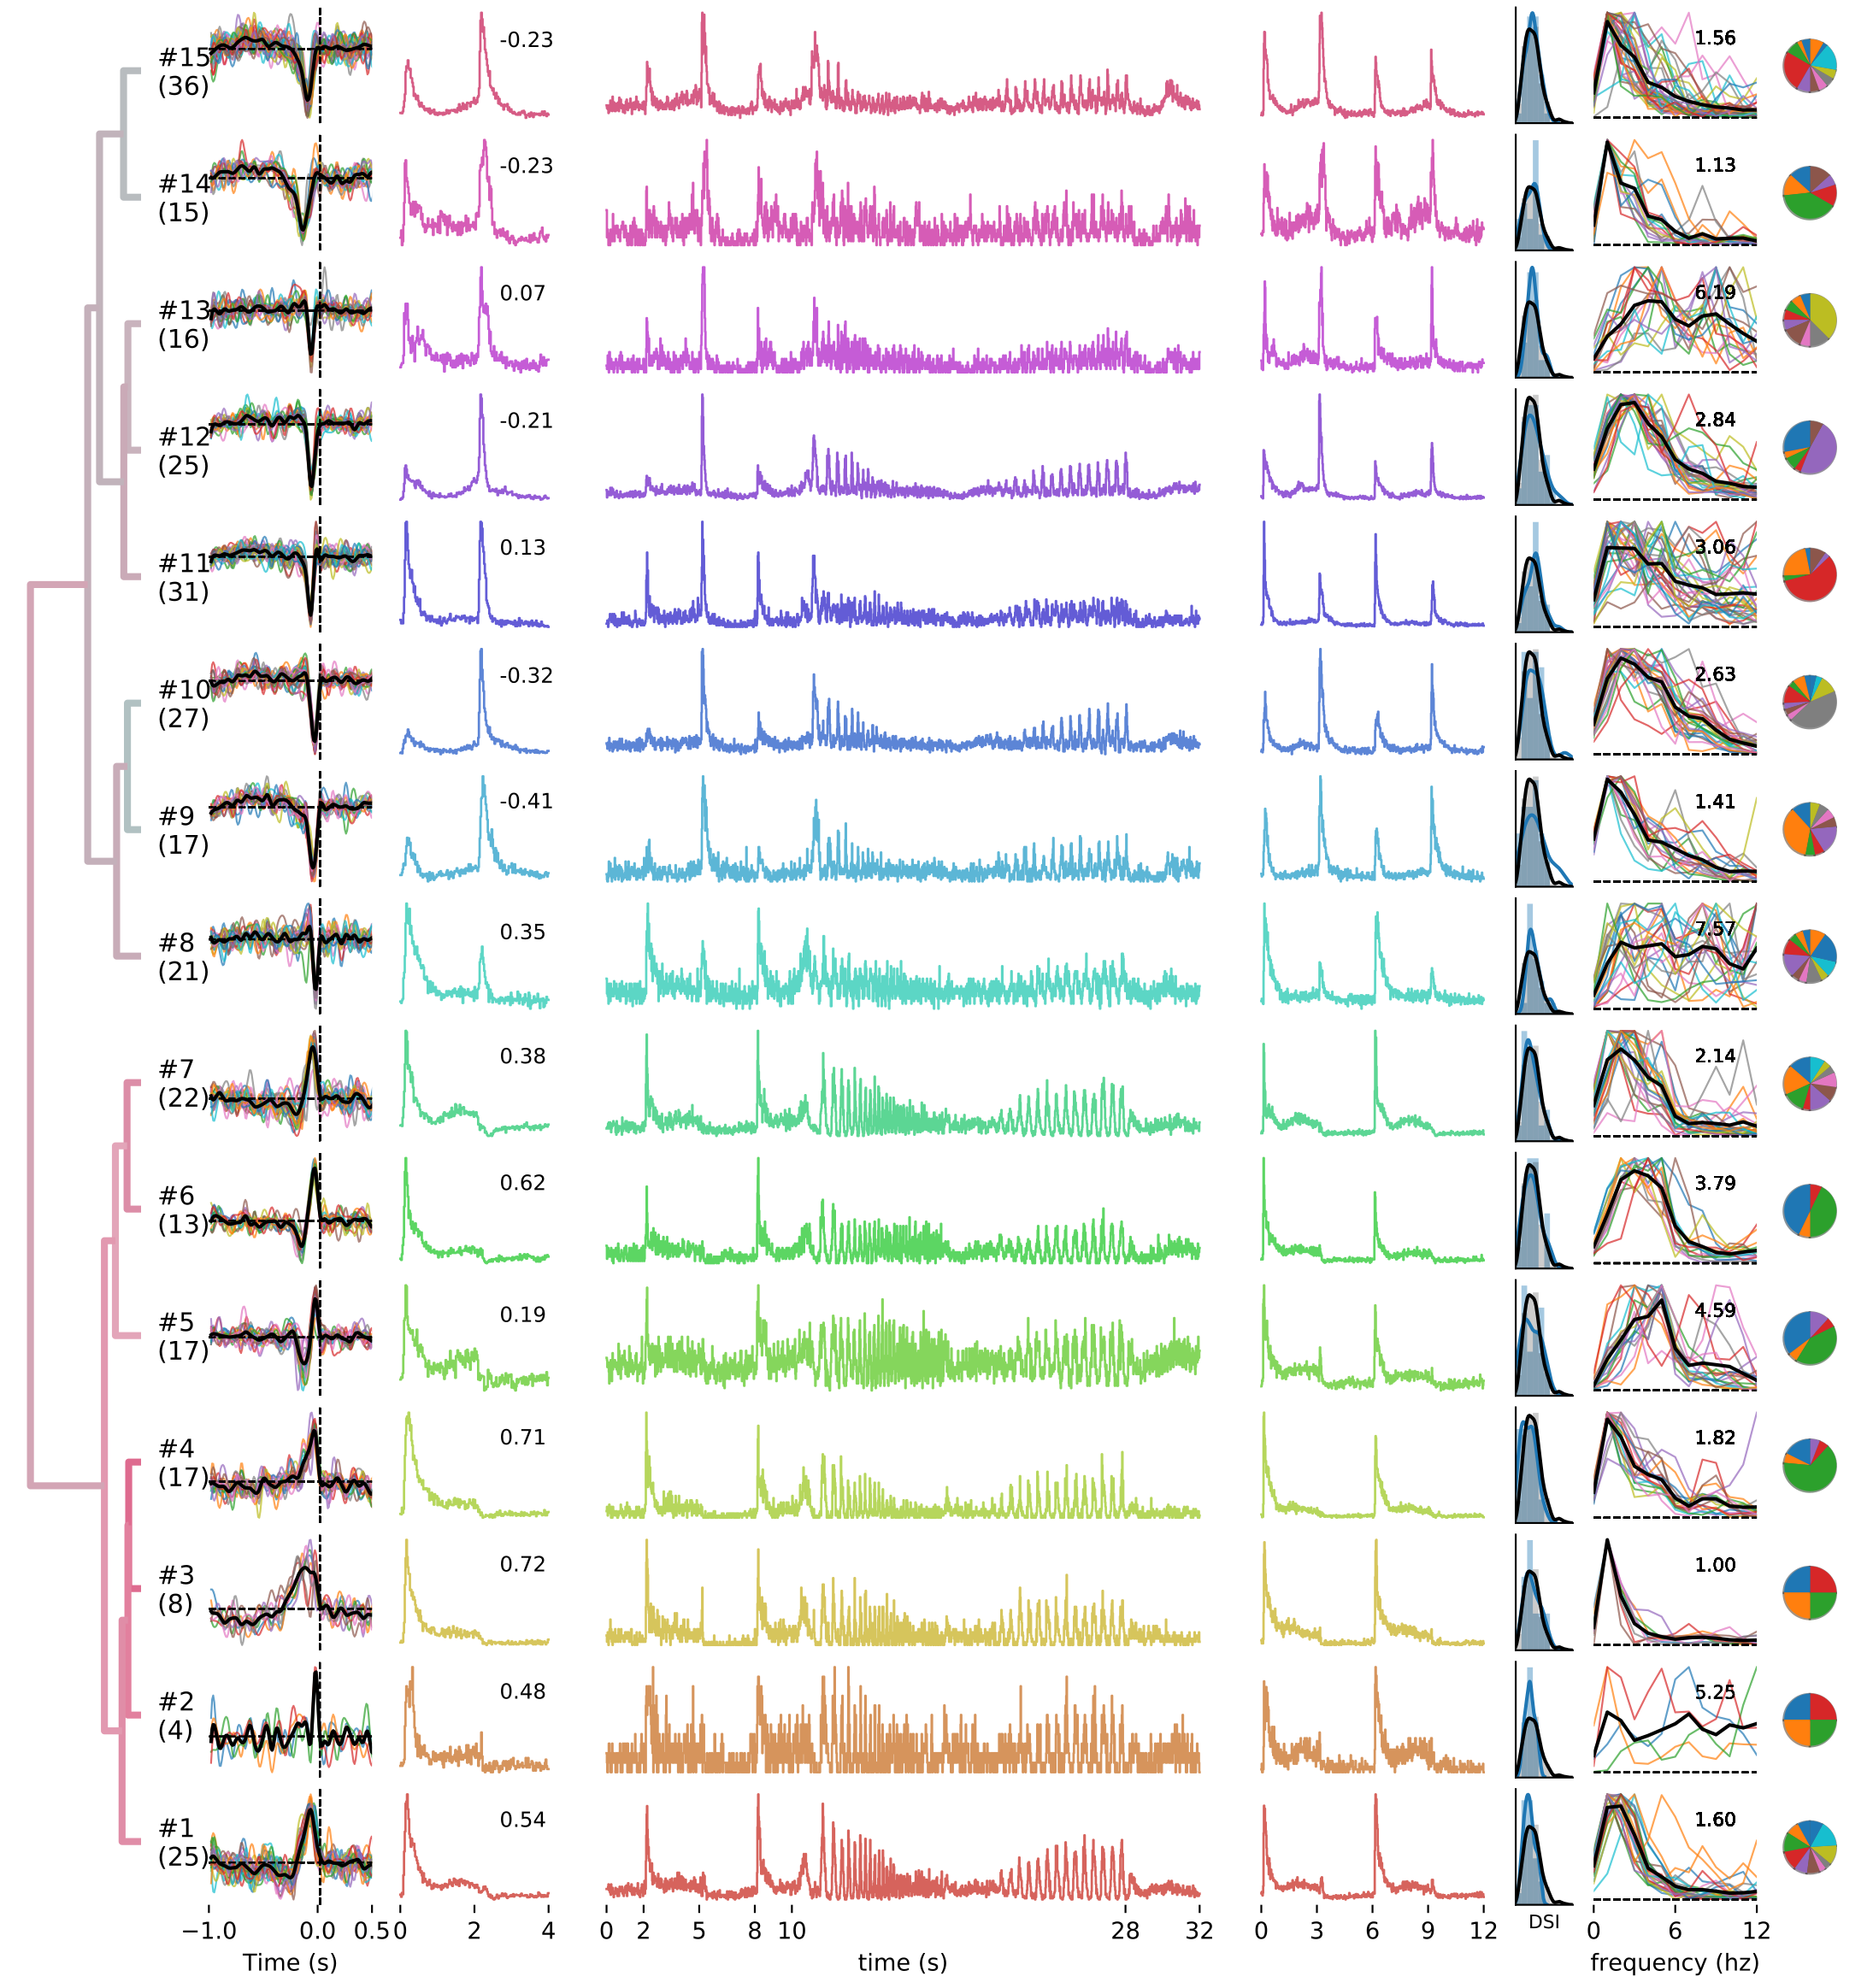
Figure 1: This figure illustrates our analyses on Churchland’s dataset. Each row illustrates the result of one data set.
The plots show how the large number of neurons (red points) are ignored during the averaging process. (a) Shows the mean of FR and FF for MT and PMd datasets.
A significant decline in FF can be seen after stimulus onset which is similar to the results provided by Churchland.
(b) FR and FF of neurons with FF ratio (spontaneous to evoked) less than 1 (Non- Quenched). After stimulus onset, the variability is increased.
(c) FR and FF for neurons with spontaneous to transient FF ratio more than one (Quenched). A sharp decline in response variability can be observed after stimulus onset.
(d) Spontaneous to transient FF ratio for all neurons. Red points represent neurons with a ratio of less than one.
Blue points represent neurons with a ratio of more than one. Gray curves represent raw FR and FF. Black curves represent mean-matched FR and FF.
Click here to see the high quality image
By analyzing neural data recorded from different layers of the V1 area, we observed that regardless of the type of stimulus,
alternations in response variability depend on the neurons type and the layer in which the neurons are
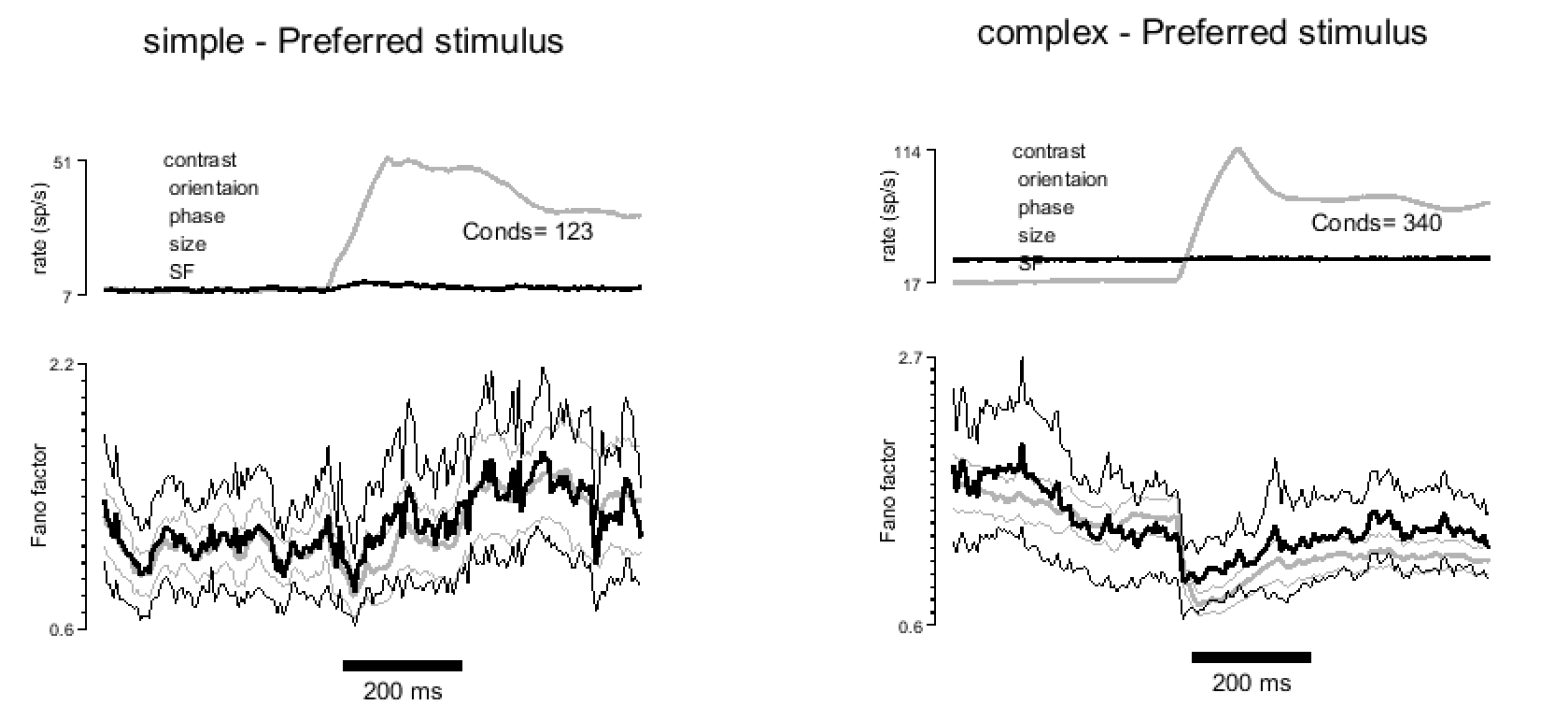
located. By classifying cells into simple and complex based on their response patterns,
we observed that the neural variability in simple cells is not changed after stimulus onset, whereas in complex cells
the FF declines after stimulus onset. In the second step, we classified neurons into inhibitory and excitatory based on the width
of their action potential. The results showed a decline in response variability of
inhibitory neurons after stimulus onset causes (figure 2).
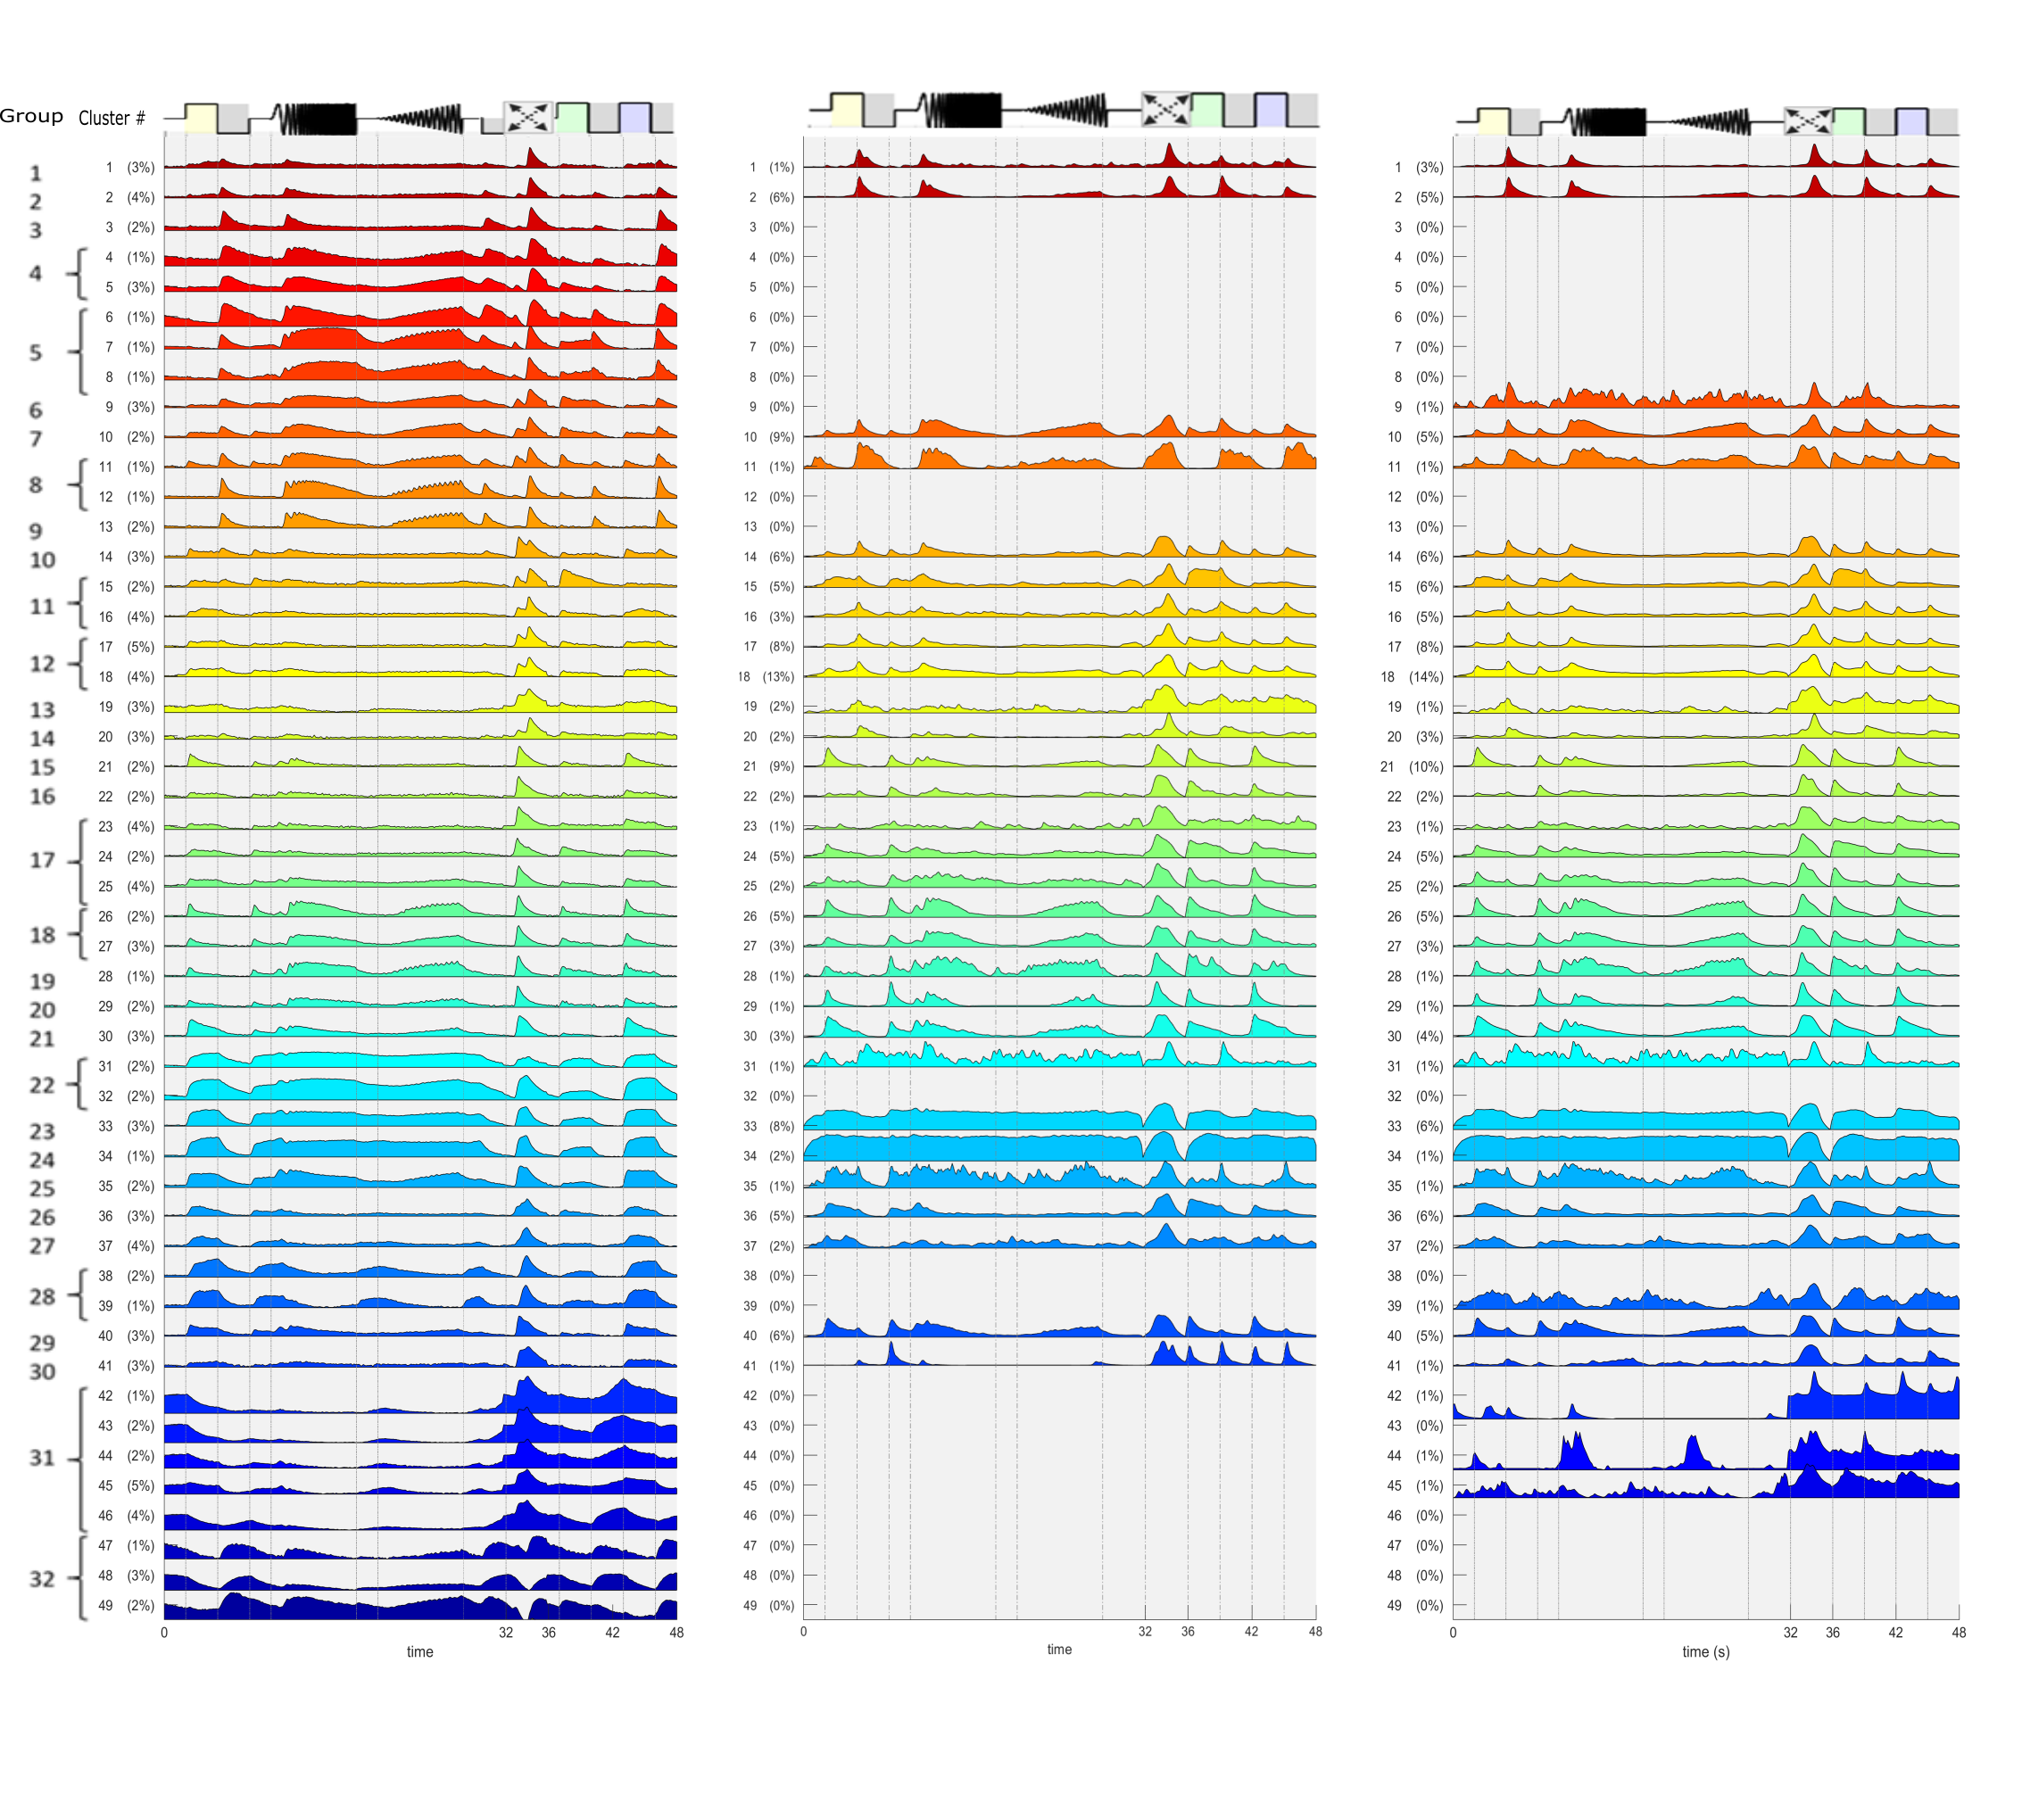
Figure 2: Firing rate and Fano Factor for simple and complex neurons.
Response variability of simple neurons is more affected by stimulus onset.
Gray traces show the raw FR and FF. Black traces Show mean-matched FR and FF.
Click here to see the high quality image
We then classified cells into sink and source based on their local field potential (LFP) signal polarity to figure out in which layer the neurons are located [4]. We found that the response variability of source neurons is not affected by stimulus onset, whereas a decline in response variability of sink neurons can be observed after stimulus onset (figure 3). From these results, we inferred that decline in response variability after stimulus onset is related to the type of neurons or the layer in which the cells are located.
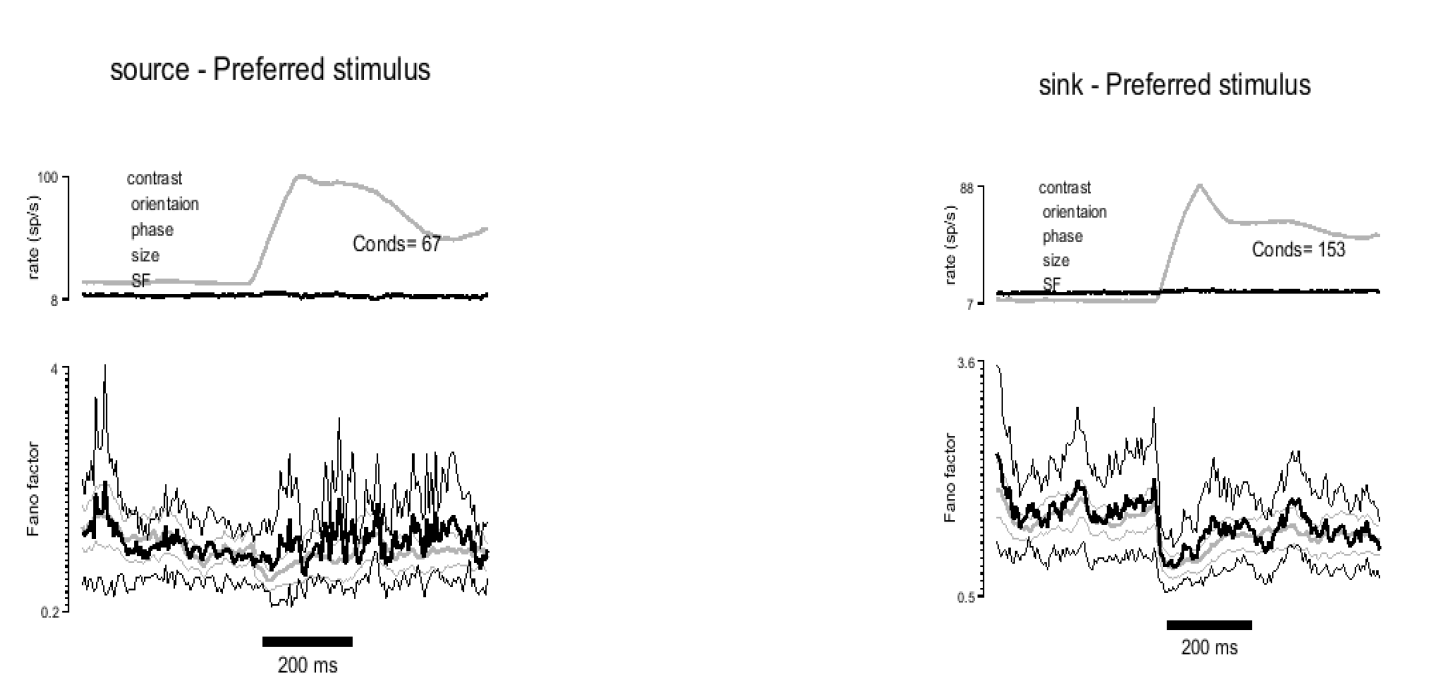
Figure 3.
Firing rate and Fano Factor of V1 sink and source neurons. Response variability is
reduced in sink neurons but not in source neurons.
Gray traces show the raw FR and FF. Black traces Show mean-matched FR and FF.
Click here to see the high quality image
Supervisor: Dr. Reza Lashgari.